

TYPE
Data Visualization/Infographics
University Project
University Project
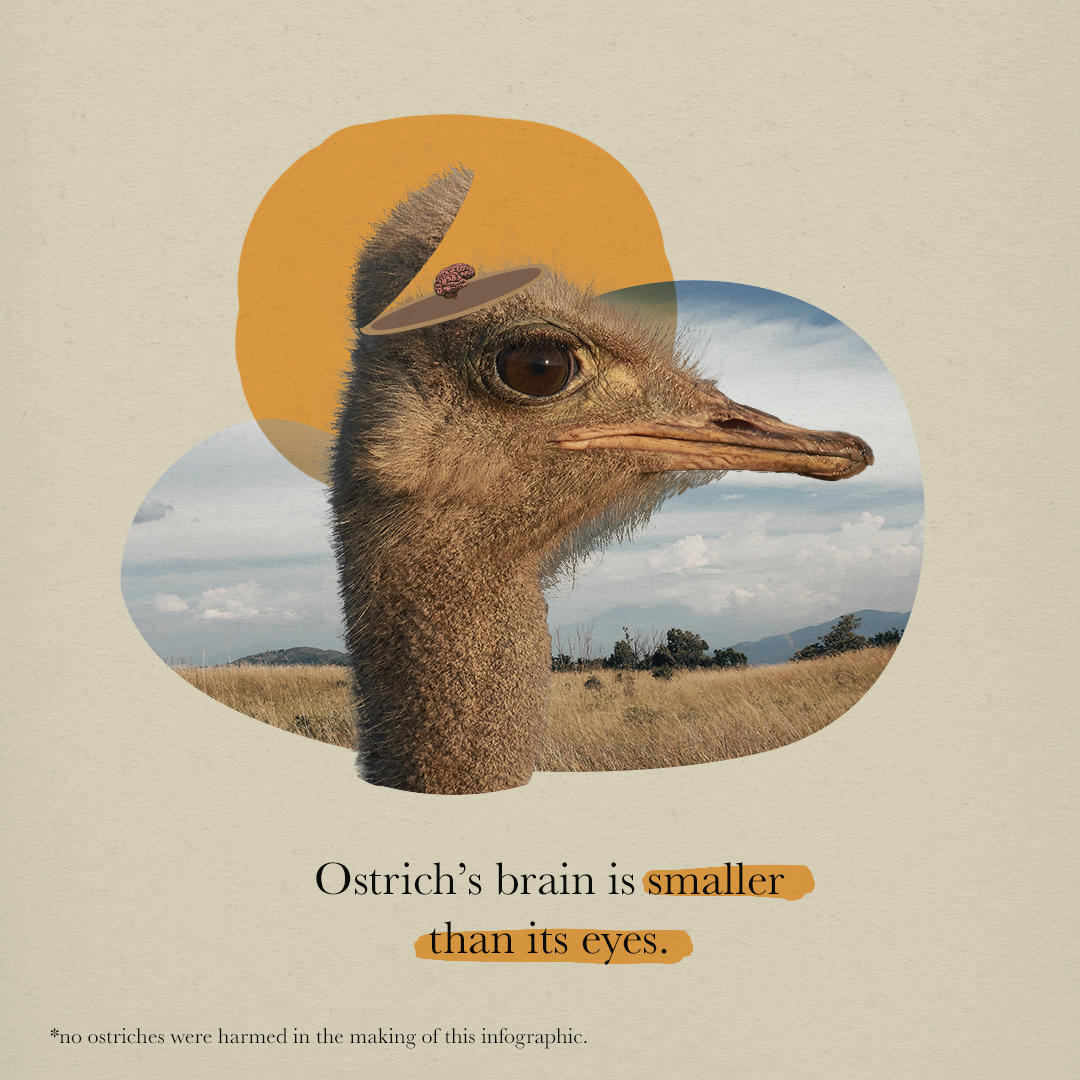
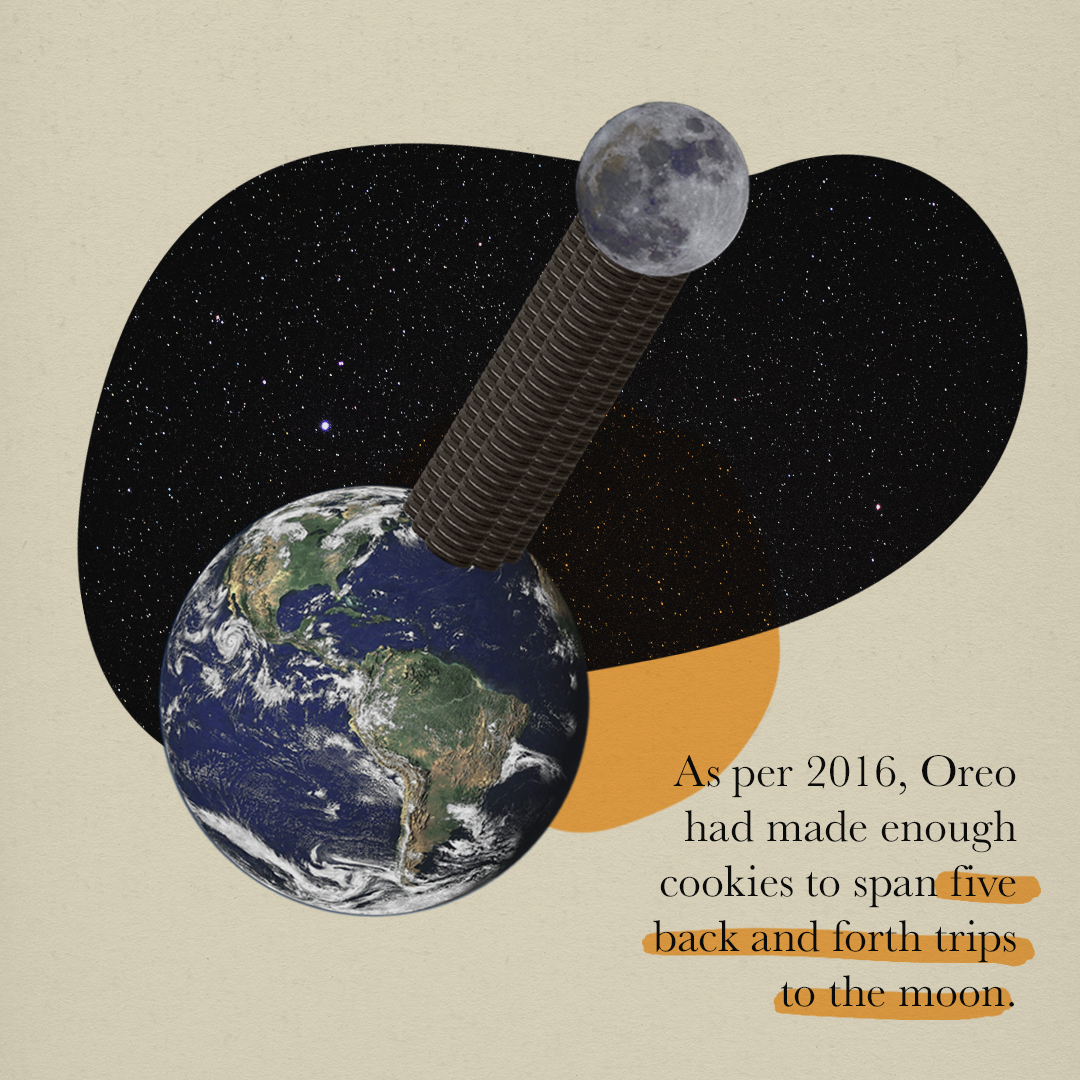
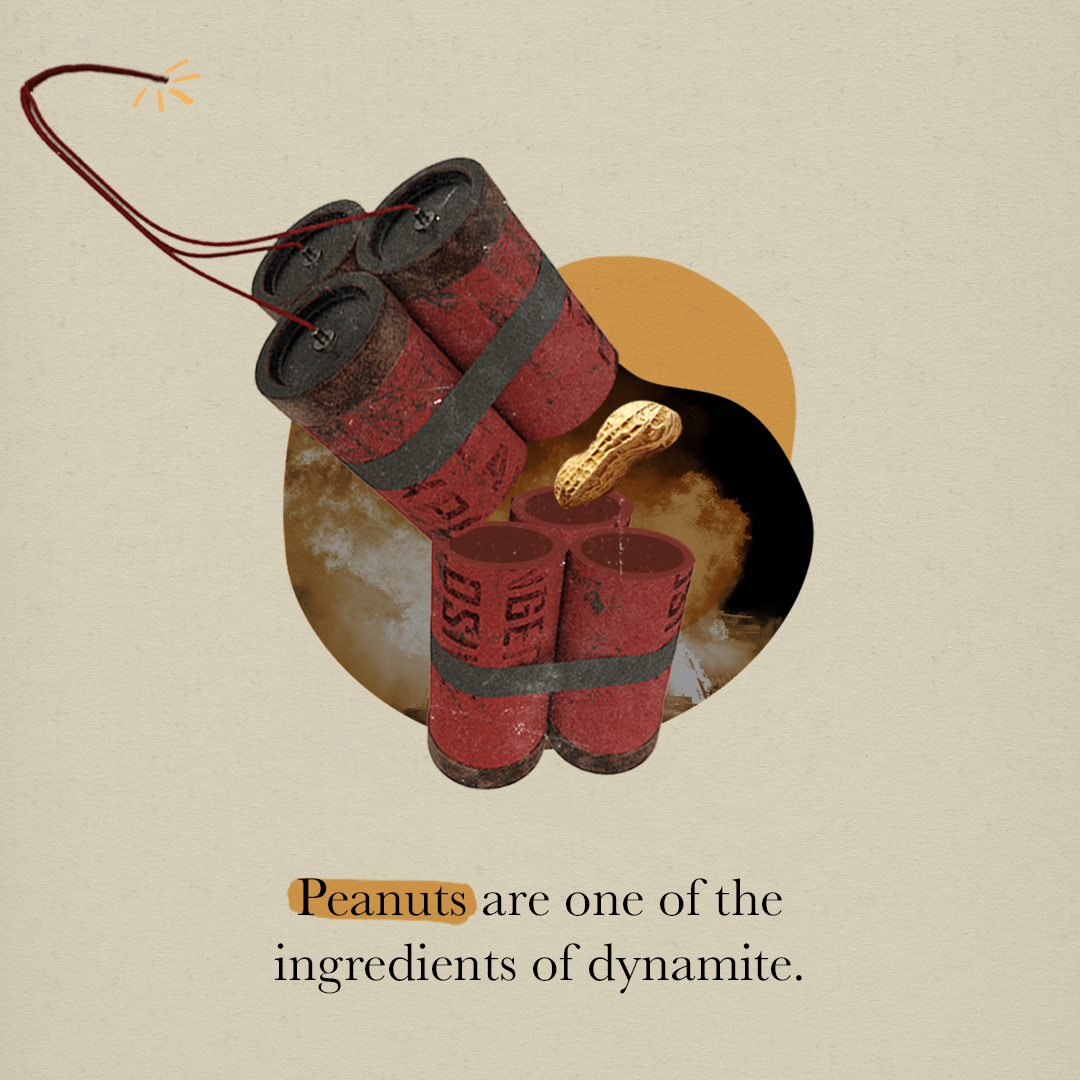
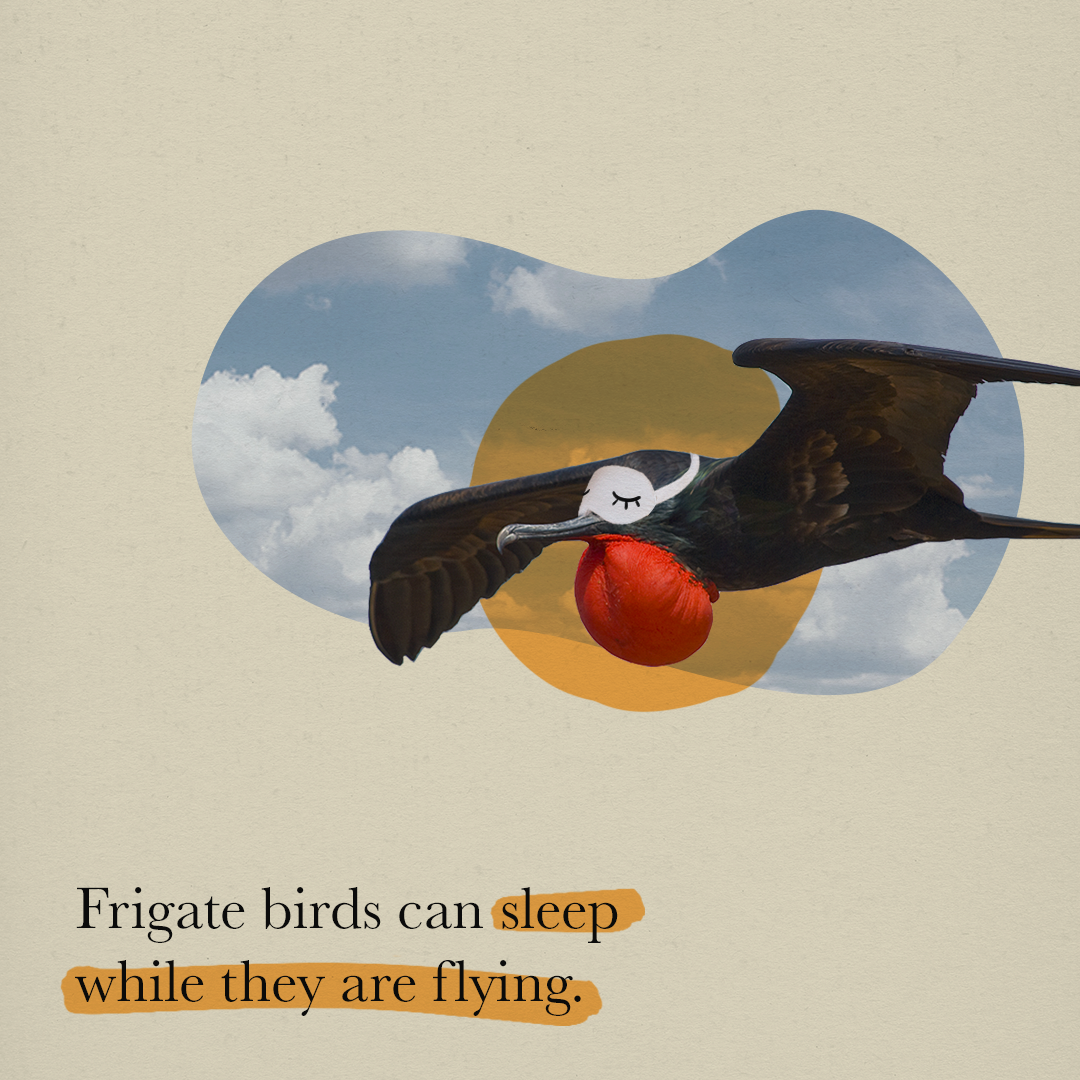
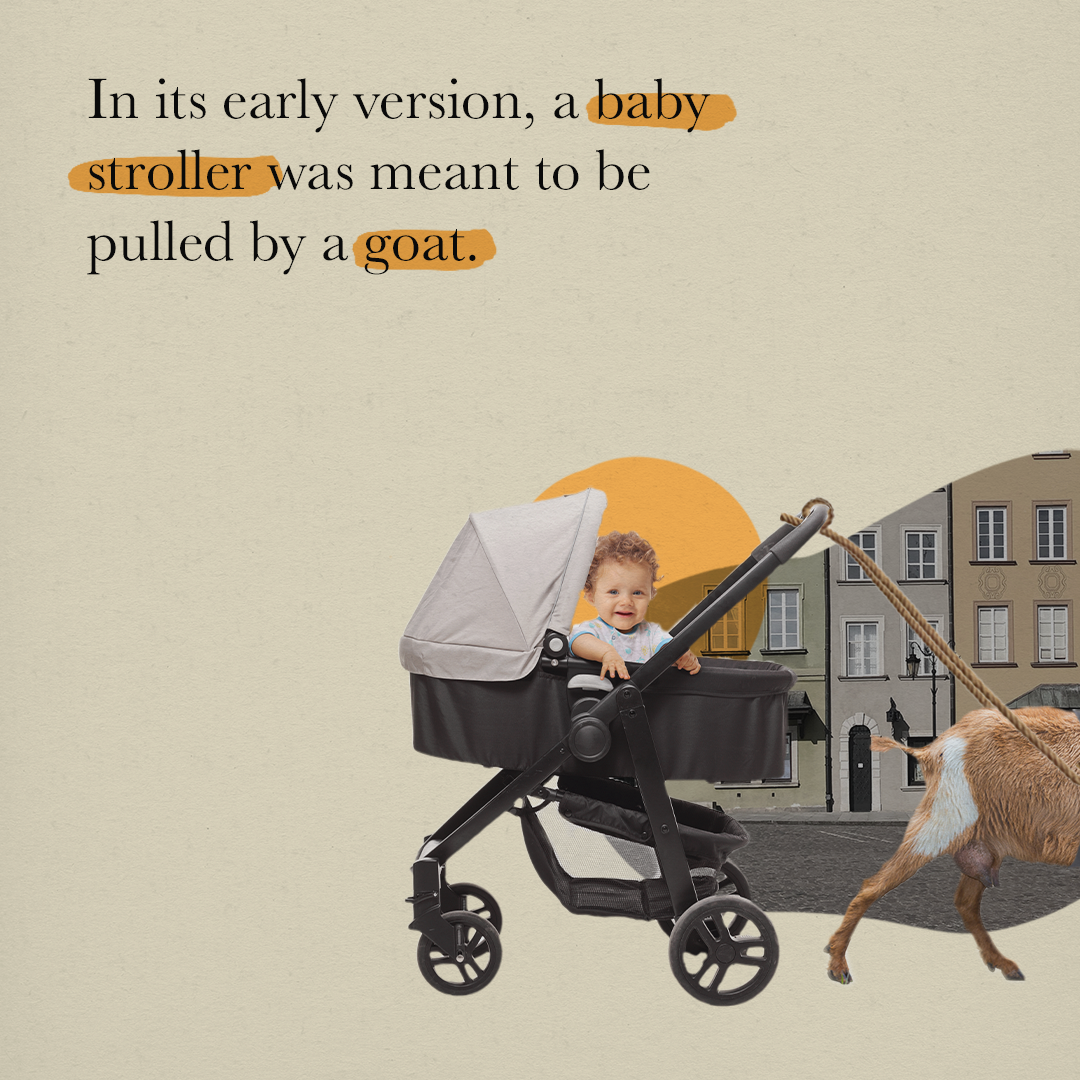
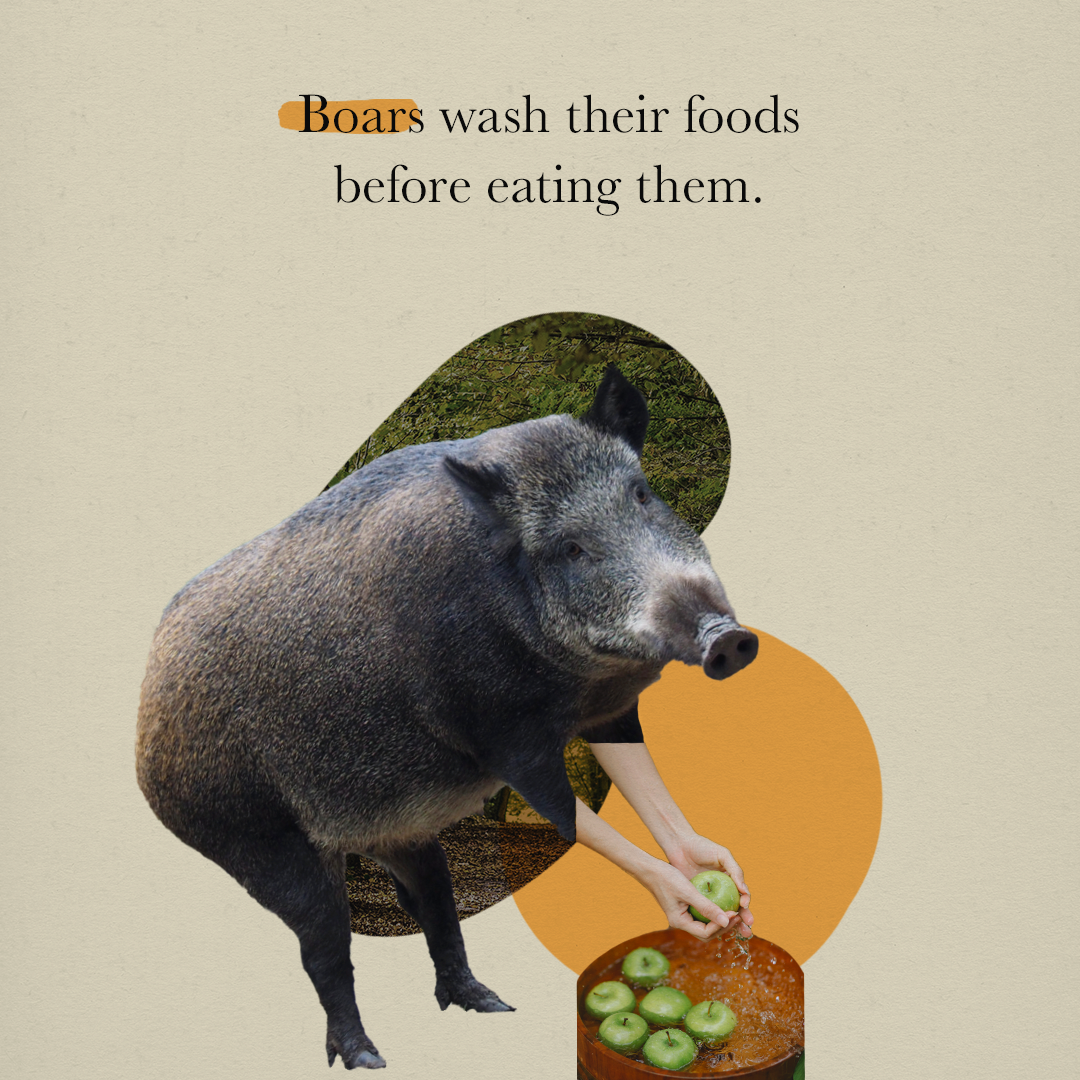
This is a fun one. The assignment given was to create an infographic. However, wanting to do something a little different, decided to make a series of infographics instead that barely qualify as infographics. Then, one day while I was laying down on my bed, all of a sudden an idea of having random useless facts popped up in my head.
As for the branding of this project, I came up with an idea to name it after a reaction that people give when they hear this type of information. From the list of reactions that I made, "huh." stood out.
I also added the orange blob that I drew by hand as an additional visual element as well as an identity to tie everything together across all the infographics while also creating uniqueness in each infographic because none of them is 100% the same as the others.
To see more, check out @huh.facts on Instagram!
